

|
Ultrasound detecting a crack in an oil pipeline using computer simulation Introduction Around the world, there are millions of kilometers of high-pressure pipelines, many of which are used to transport oil. Generally, distribution of crude oil through pipelines is one of the most secure methods. However, defects may occur and grow in the pipeline until the pipeline ruptures, with obvious serious consequences. Therefore, it requires that special attention be made to non-destructive testing of the pipeline, and in particular to cracks that may be present, especially to stress corrosion cracking. Currently, there are pipeline assessment devices (called "pigs") available that use ultrasonic technology to detect pipeline wall cracks. This equipment is transported inside the pipeline by the flowing crude oil, while at the same time ultrasound measurements are performed. This method can be used to assess up to hundreds of kilometers of pipeline in one run.
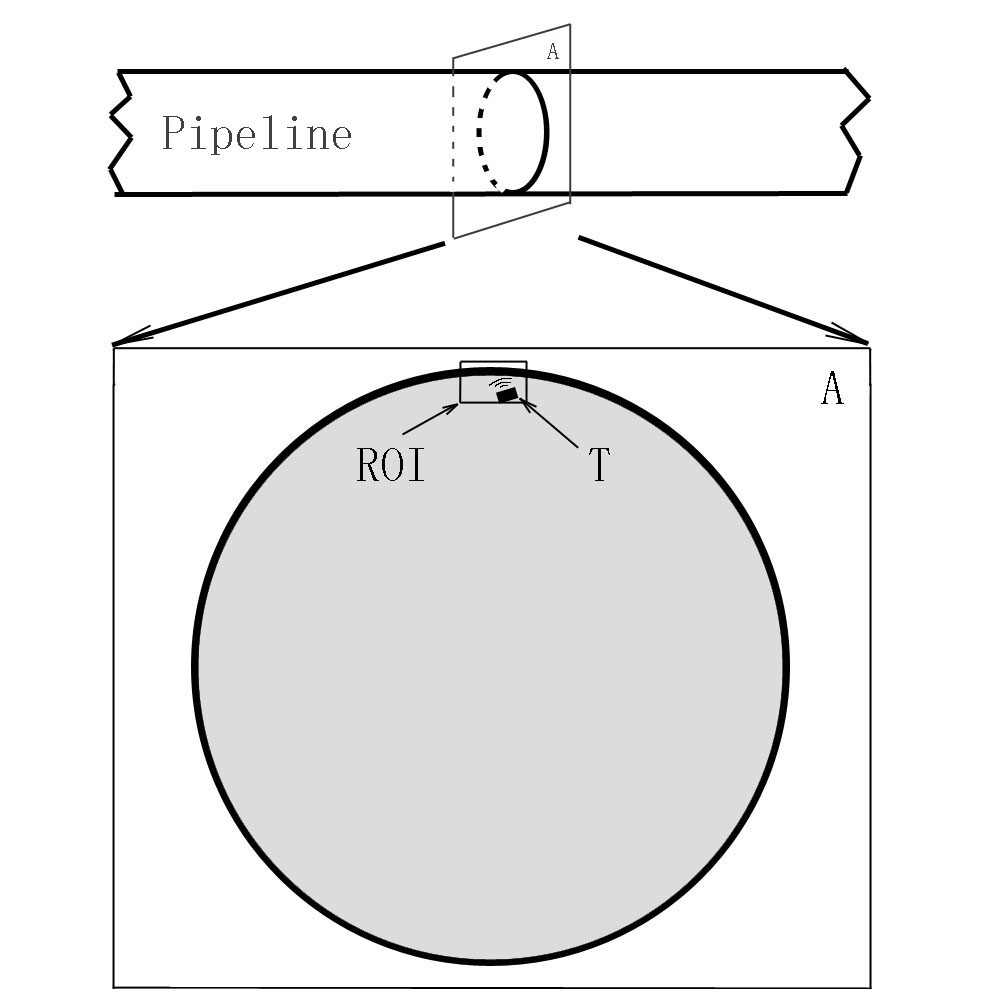
Simulation Model Ultrasound is often used in non-destructive testing, for example for crack detection in an oil pipeline. In this example, we will show you how to create a computer simulation model that demonstrates how ultrasound can detect a crack in pipeline. In the figure below, the upper part shows a sector of a pipeline, and a plane "A" intersecting the pipeline perpendicularly. The lower part shows the enlarged cross section; the circle represents the steel wall of the pipeline, with the inside filled with petroleum (in grey), and the outside surrounded by water. (Note that it is simple to replace water with another material, e.g., air.) The letter "T" indicates that there is an ultrasound transducer placed inside the pipe, which emits an ultrasound signal towards the wall and receives the reflected signal, i.e., the transducer is operating in pulse-echo mode. The rectangle marked as ROI is the region that will be simulated in this example.
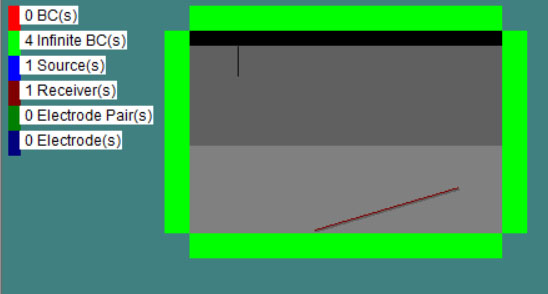
The figure below is the simulation model, with the region simulated being the same as the ROI shown in the above figure. The program used for this example is Wave2000 Plus. In the 2D model, there are three layers of materials, the top layer is 1 mm of water, the middle layer is 6.34 mm of steel and the bottom layer is 5.66 mm of petroleum. The infinite boundary conditions (in green) are used to simulate the large region surrounding the ROI. The figure shows a 2 mm long vertical crack in the steel wall of the pipe; the crack is 0.008 mm thick and is assumed in the model to be filled with water (again it is easy to replace the water-filled crack with any material, including air). A source ultrasound transducer (9.54 mm in length) is placed in the petroleum at an angle of 16.5 degrees. It emits a "Sine Gaussian Pulse" with a center frequency of 5 MHz. A receiver is placed at the same location as the source. The source-receiver pair work together in pulse-echo mode. For comparison purposes, the same model as the one described above but without the crack is also simulated.
Results Each Wave2000 Plus model requires about 10 minutes to simulate on a desktop computer (Intel CORE i7 970, 3.2 GHz 6-core CPU) the 15 microseconds that are displayed in the animated gif images below. The figure below shows the simulation result for the model with the crack:
The figure above shows clearly that there is a signal that has propagated to the crack and been reflected back to the receiver transducer. For comparison, the simulation result of a model without crack is shown in the following figure. As may be seen, no signal is reflected back from a crack.
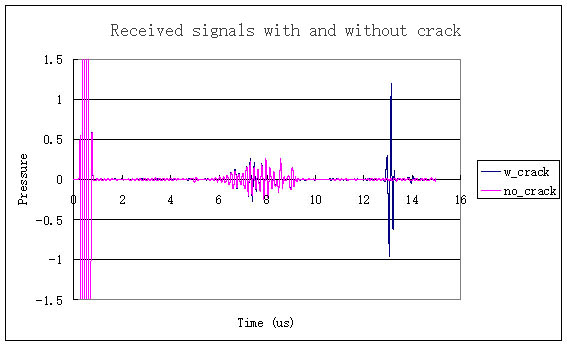
To quantitatively measure the reflected signals, the following plot shows the time-domain signals received for the two simulation models, with and without the crack, respectively. (Note that the software allows the user to save the received waveforms in files for post-processing and analysis.)
The plots above show that model with a crack in the pipe has an associated "crack signal" that appears at about 13 us, and that no such signal exists for the simulation model without a crack. The signal strength and shape will be affected by the crack size, shape, position and orientation, all of which are easy to examine with appropriate modifications to the simulation models. Wave2000 Plus models The Wave2000 Plus model files for the two models can be downloaded from our Download page. If you want to run the simulations or create your own models, you can use Wave2000 Plus with a free evaluation license. For more information, please go to the Download page. Important tips about these simulations, in case you want to try some of your own for pipe-crack detection: (1) When you add a source in Source Configuration, check "Shear Mode" and use "None" as Time Function; (2) Also in Source Configuration, after setting up all the parameters for "xmitter", check "Pulse-Echo" and click on "Apply" and then "OK". Then open Receiver Configuration, rename "xmitter Echo' to another name, e.g., "xmitter_echo", and change Data Type to "Pressure", and click "Apply" and "OK". The last step is to start Source Configuration again, un-check "Pulse Echo" and click on "Apply" and then "OK". Previous Example |
|||||||||


© 2024 CyberLogic, inc. All Rights Reserved