Wave2000 Example #2:
Porosity effects and material characterization.
The figure below is a single "slice" of a micro-computed tomographic image of a cylinder of human calcaneal (heel) trabecular bone. The bone trabeculae (with thicknesses on the order of 100 microns) are represented by the light regions and the marrow spaces are represented by the black regions. (The bone imaging data is courtesy of Dr. John Kinney of Lawrence Livermore Laboratories, Livermore, CA.)
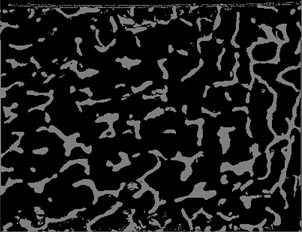
Use Wave2000 to study highly scattering structures. The ultrasound "movie" below is comprised of 3 images of an ultrasound wave propagating through the trabecular bone slice shown in the previous figure. As may be seen, there is a large amount of scattering of the 1 MHz ultrasound pulse (produced by a 1 cm source transducer located on the left side of the object), in what may be described as a "mode stirring" phenomenon. A longitudinal receiver (also not shown) is configured in "through transmission mode," i.e., is located "coaxially" with respect to the source on the right side of the sample. Note that Wave2000 displays only the boundaries between disparate materials in an interrogated object during a simulation, so that the propagating wave can be visualized.
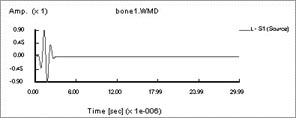
A variety of source waveforms can be utilized in Wave2000 simulations. The plot below shows the ultrasound source waveform transmitted into the bone by a transducer on the left side of the sample. Wave2000 has a set of source waveform types that may be used in a simulation. In addition, users may incorporate their own waveforms (e.g., data from a particular transducer in their lab) by using a Wave2000 "source file option."
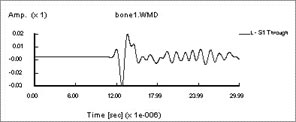
Through transmission measurements are simple to define in Wave2000. The plot below shows the ultrasound waveform measured by a through transmission receiver on the right side of the bone. The received waveform displays characteristics often observed in "real world" measurements. For example, there appears to be phase cancellation distortion towards the end of the main pulse. Also, there is significant amount of signal energy received after the main pulse comes through, showing a remarkable similarity to reported observations.
Wave2000 has "built-in" analysis routines. Although Wave2000 allows the user to plot and save receiver measurements in an ASCII file (for subsequent processing by a user's own custom software), Wave2000 also comes with a small set of "built-in" analysis routines. The one shown below is a "transit time" velocity calculation which allows the user to compute the apparent velocity of the ultrasound wave measured at a specified receiver, with respect to a specified source. It also displays several velocities based on distinct "arrival time" criteria. Not shown but also included in the Wave2000 Analysis features is the ability to compute the frequency-dependent attenuation of a receiver waveform with respect to a given source waveform.
Wave2000 can be used in practically any materials characterization problem. The user may explore how, for example, porosity and architecture (structure) affect the propagation (e.g., velocity and attenuation) of ultrasound. In addition, Wave2000 can be used to test a new idea for material characterization (e.g., a novel positioning of a receiver on an interrogated object). One can also explore how changing the material properties of the constituents making up the interrogated object affects the propagation. For example, in this bone assessment application, it is of interest to examine the effects of replacing blood by water or fat or void in the marrow spaces of the bone sample. Such modifications are simple to do with Wave2000.