Wave2500 Example #1:
Cladded Rod
The figure below shows a steel rod cladded with a plastic tube. The steel rod is 20 mm in diameter and the overall diameter is 40 mm, and the length is 30 mm. As with all Wave2500 simulations, the object is shown as a cross-section, since a single cross-section is sufficient to characterize the entire (axisymmetric) object. In Wave2500, the upper left corner of the object image is the r=0, z=0 point, while the bottom right is r=rmax and z=zmax, where rmax and zmax are the maximum values of the radius, r, and height, z, of the object, respectively. Thus the upper left corner of the 2D image is actually the center of the top face of the cylinder, while the bottom left corner is the center of the bottom face of the cylinder, and the entire left side is the central cylindrical axis. Note that the 2D image shown here is actually 1/2 of the entire cross-section of the cylinder. Think of the actual object being generated by revolving this cross section around the cylinder axis (i.e., rotating by 360 degrees the cross-section around its left edge).

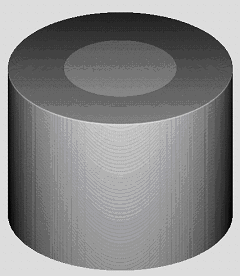
A 3D viewer allows the user to visualize the actual object (see the figure below). Not shown but defined for this simulation are a 40 mm diameter circular source transducer centered on the top of the cladded rod, and a 40 mm diameter circular receiver transducer defined on the opposite face (at the bottom) of the cylinder, operating in through transmission mode. Thus both the source and receiver cover the entire top and bottom faces of the object, respectively.
Wave2500 generates "step-by-step" images of the propagating ultrasound wave. The ultrasound "movie" below displays a 1 MHz sine wave with a Gaussian envelope propagating down the cladded rod.
Wave2000 plots and/or saves all transducer source and/or receiver data. The figure below displays a receiver plot associated with this cladded rod simulation model. The graph shows the measurements associated with the through transmission receiver. As may be seen, the source waveform (in blue) is displayed at the very beginning of the plotted signal. The transmitted waveform measured by the receiver at the bottom of the cladded rod is shown in red and green, representing the longitudinal and shear signals at the receiver, respectively.